
This week markets heaved a sigh of relief as the US and Iran agreed a ceasefire and committed to negotiations toward a permanent end to hostilities. The truce appears fragile with violations of the agreement claimed by both sides. More concerning, there seems to be disagreement over several issues at the heart of the planned negotiations. Most critical is the question of safe passage through the Strait of Hormuz. By Friday morning, Hormuz remains effectively closed and market sentiment appears slightly more pessimistic about the ceasefire.
However, the market reaction on Wednesday was less about the immediate end of the war – as it will take weeks for global shipping to normalise and far longer to repair damaged infrastructure – and more to do with long-term intentions. There is plenty of scope for the ceasefire to collapse, were that to happen, expect the recent rally to reverse and concerns about inflation or stagflation to return. But both sides are clearly looking for a way to end the war and markets are positioning for a long-term solution.
Markets surged on Wednesday as a two-week US-Iran ceasefire triggered a rally. European equities led the move. The Stoxx 600 gained 3.7%, Germany’s DAX was up 5% and the FTSE 100 added 3%. Airlines bounced hard, with Air France-KLM and Lufthansa both rising around 12%, while Société Générale and Barclays each gained roughly 8%. Asian markets also gained, with South Korea’s Kospi up 5% and Japan’s Topix rising 3.4%. Government bond yields fell sharply as traders scaled back rate-rise bets, with UK two-year gilt yields dropping 22 basis points to 4.2%, though they remain above pre-war levels. Brent crude fell 15% to $93 a barrel, yet sits roughly $25 above its pre-conflict level.
The rally, though sharp, may be getting ahead of itself. Cargo insurance rates have halved since the ceasefire but remain 37 times their pre-war level. With 1,000 vessels still stranded in the Persian Gulf, Hapag-Lloyd warns of six to eight weeks before normal operations resume. Maersk, too, is waiting on passage conditions before committing to brave Hormuz.

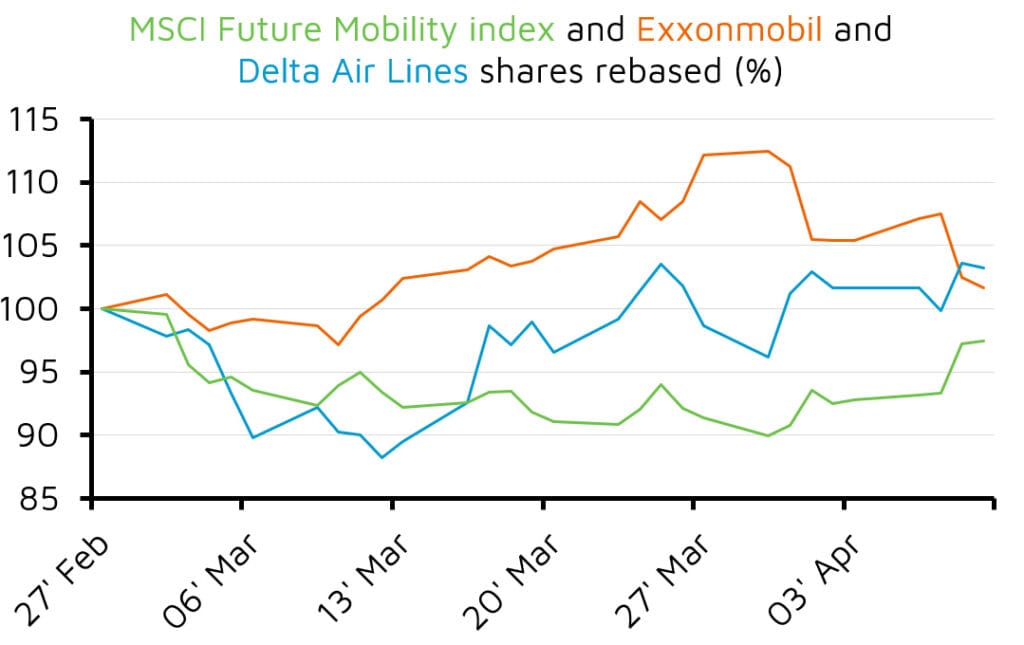
High oil and gas prices continue to shape the global economy. Energy giant ExxonMobil says the war reduced its output in the first quarter by 6% and it expects lost production and trading profits to reduce earnings by $1bn to $1.6bn. Delta Air Lines is cutting some routes and raising bag check-in charges as it tries to offset a $2bn increase in fuel costs. Demand for electric cars has surged. EV sales in the UK hit a record of 86,000 in March, up more than 17,000 on last year. Chinese EV exports hit 349,000 in March, an increase of 140% on last year.
Chinese firms are adapting to higher costs as producer prices increased by 0.5% in March, having fallen –0.9% in February. High oil prices are also filtering through to consumers. US consumer expectations for inflation increased to 3.4% from 3% in February. Disruption to oil and gas production in the Middle East have seen US energy exports hit record levels as oil exports are predicted to hit 5.3m barrels a day in April, up from less than 4m in March.
Anthropic dominated the week’s AI news. Annualised revenues have surged from $9bn at year-end to $30bn by end of March, driven largely by its coding application, while hundreds of billions committed to Google and Broadcom will secure roughly 5 gigawatts of computing capacity. It also launched Claude Mythos, a restricted cybersecurity model for vetted partners including Amazon, Apple and Microsoft, which has already flagged thousands of previously unknown software vulnerabilities. Meta unveiled Muse Spark, its first model since Zuckerberg’s costly restructuring of its AI division, sending shares up 8%. Samsung forecast a first-quarter operating profit of $38bn, more than its entire 2025 figure, citing growing demand for AI-capable memory chips.
Perplexity reported a 50% monthly revenue jump to $450mn after pivoting to AI agents and usage-based pricing. The human cost is sharpening: around 80,000 tech jobs were cut in Q1, roughly half attributed to AI.
Sources for charts: FE Analytics
This article contains general information only.
This is not a financial promotion and is not intended as a recommendation to buy or sell any particular asset class, security or strategy.
All information is correct as at 10/04/2026 unless otherwise stated. The expressed opinions are based on current market conditions, they may differ from those of other investment professionals and are subject to change without notice.
This communication contains information on investments which does not constitute independent research.
Published by our partners at FE Invest.
The value of your investments can go down as well as up, so you could get back less than you invested. Past performance is not a reliable indicator of future performance.