
Oil, AI and Uncertainty: What’s Driving Markets Right Now
COST OF WAR IN THE MIDDLE EAST IS RISING AS…
This week, Washington and Tehran moved closer to a deal that would extend the ceasefire by 60 days and reopen the Strait of Hormuz, with Brent slipping to $91 a barrel by Friday morning. The terms remain pending Trump’s signature, but Chevron’s chief warned that inventory buffers are drawn down to the point where physical prices will rise into June and July regardless. Adnoc’s chief went further, saying full flows would not return before Q1 2027. The energy crisis has already landed on UK households, with Ofgem lifting the price cap by 13% from July.
Optimism is being priced more cheaply elsewhere. The chip rally that carried memory makers SK Hynix and Micron past $1tn this week found a sharper anchor on Thursday, when Anthropic closed a $65bn funding round at a $965bn valuation, with all three of the world’s biggest memory chipmakers participating as investors. Behind both stories sits a slower one. Banks have $1.3tn of fresh lending capacity from lighter capital rules in Washington and London, while offshore wealth tilts east from Switzerland to Hong Kong.
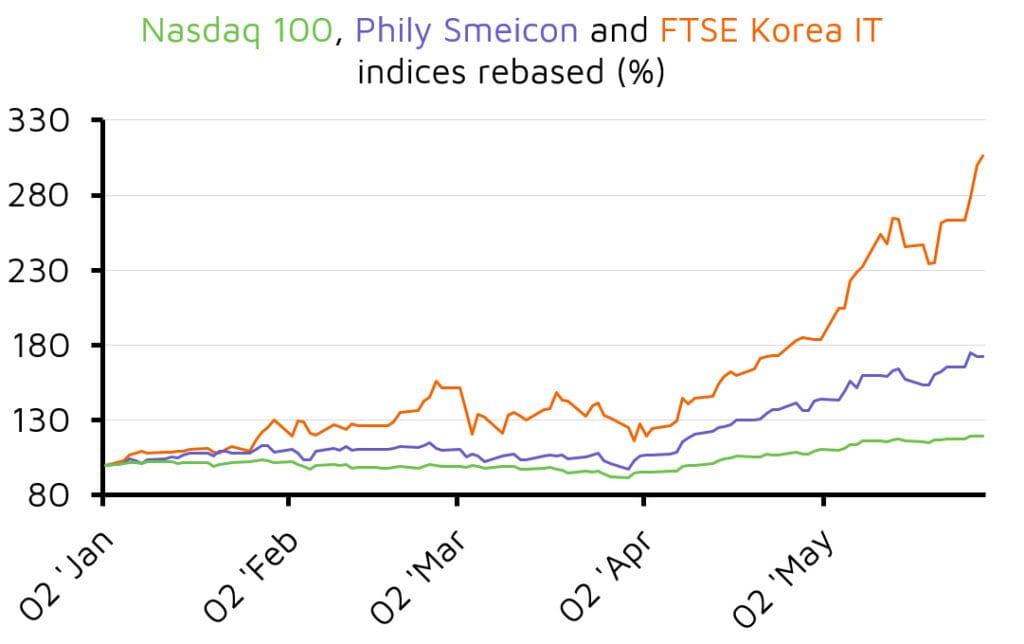
The semiconductor sector is on track for its strongest year since 1999. The Philadelphia Semiconductor Index has climbed roughly 75% in 2026, adding more than $5tn in market cap since the rally accelerated in late March. Meta, Alphabet, Amazon and Microsoft are driving the surge, with plans to commit $725bn to data centres this year. Nvidia still leads at $5.2tn, but Intel, AMD and Arm have outpaced it as buyers bet on CPUs alongside GPUs, broadening the rally beyond a single name.
Memory chipmakers have surged the most. South Korea’s SK Hynix and Micron crossed the trillion-dollar mark this week, joining Samsung, which passed it in February. Shares are up 1,007%, 859% and 469% respectively over 12 months. The Roundhill Memory ETF (DRAM) gathered $10bn within 50 days of launching in April, the fastest pace on record. Earnings are keeping pace, with Philly index profit estimates up 69% this year. But JPMorgan’s Jamie Dimon has flagged the exuberance, citing chip downturns in 1972, 1986, 2000 and 2007.
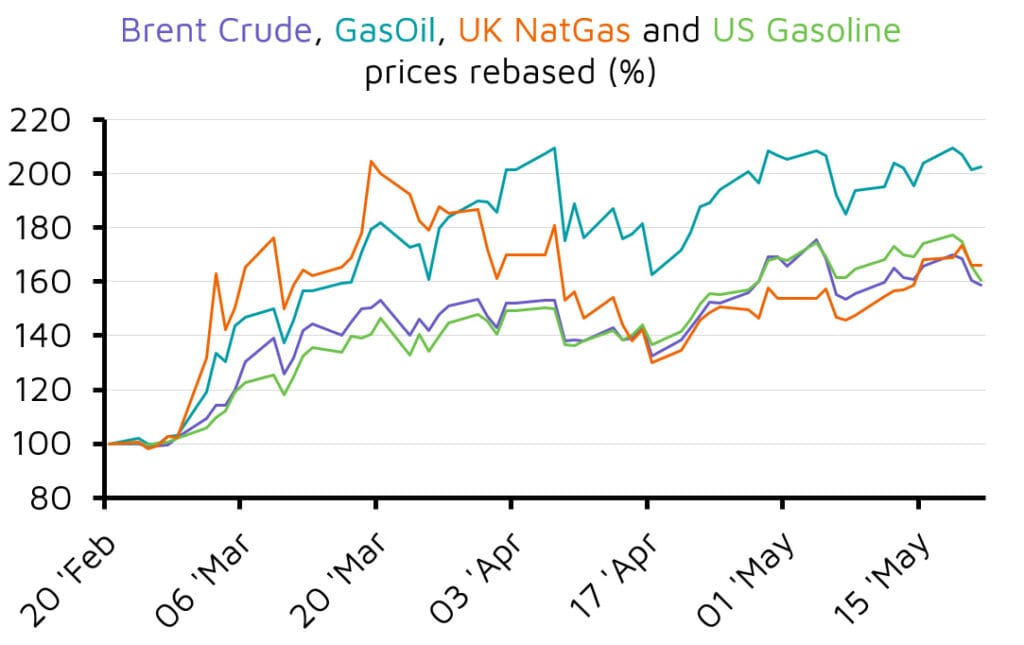
Oil markets remain volatile and elevated. Brent has risen roughly 60% since the war began on February 28, swinging between $91 and $101 a barrel this week as ceasefire signals shift. Markets are pricing the words, not the actions. The Strait of Hormuz, which normally carries a fifth of the world’s oil and LNG, is largely shut, knocking around 12m barrels a day off supply. Roughly eight Gulf refineries are offline, alongside Qatar’s Ras Laffan LNG hub, the world’s largest.
US shale producers are responding. Diamondback and Continental Resources are ramping up drilling, and Continental has lifted capex by $300m to $2.8bn. The US rig count has risen by 18 since February to 425, and output could hit a record 14.2m barrels a day by late next year. The bill is landing on households. American consumers have paid $40bn more at the pump. Ofgem will raise the UK energy price cap 13% to £1,862 a year from July, as wholesale gas trades 60% above pre-war levels.
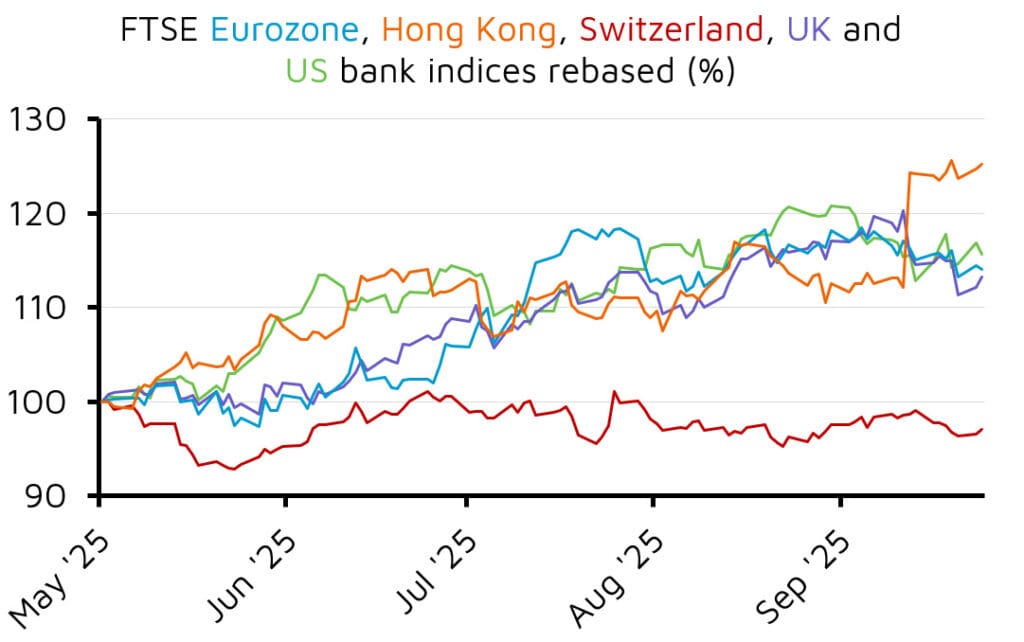
Lighter capital rules in Washington and London have handed top US and UK banks $1.3tn of extra lending capacity over the past two quarters, with Alvarez & Marsal projecting the total to reach $2.9tn. EU banks face the opposite pressure, with seven of the bloc’s biggest lenders set for €39bn in tougher requirements. JPMorgan stands out. Chief Jamie Dimon told a conference this week that the bank holds $40-50bn of spare capital and could spend $10-20bn on a deal in coming years, though he warned that valuations are stretched.
Wealth management is tilting east. Hong Kong has displaced Switzerland as the leading centre for offshore wealth, booking $2.9tn of cross-border assets in 2025, around 60% from mainland China, according to Boston Consulting Group. BCG expects the gap to widen to almost $600bn by 2030. Singapore is climbing fast too, from $2.1tn towards $3.3tn, as clients spread wealth across jurisdictions to hedge geopolitical risk.
Sources for charts: FE Analytics
This article contains general information only.
This is not a financial promotion and is not intended as a recommendation to buy or sell any particular asset class, security or strategy.
All information is correct as at 15/05/2026 unless otherwise stated. The expressed opinions are based on current market conditions, they may differ from those of other investment professionals and are subject to change without notice.
This communication contains information on investments which does not constitute independent research.
Published by our partners at FE Invest.
The value of your investments can go down as well as up, so you could get back less than you invested. Past performance is not a reliable indicator of future performance.